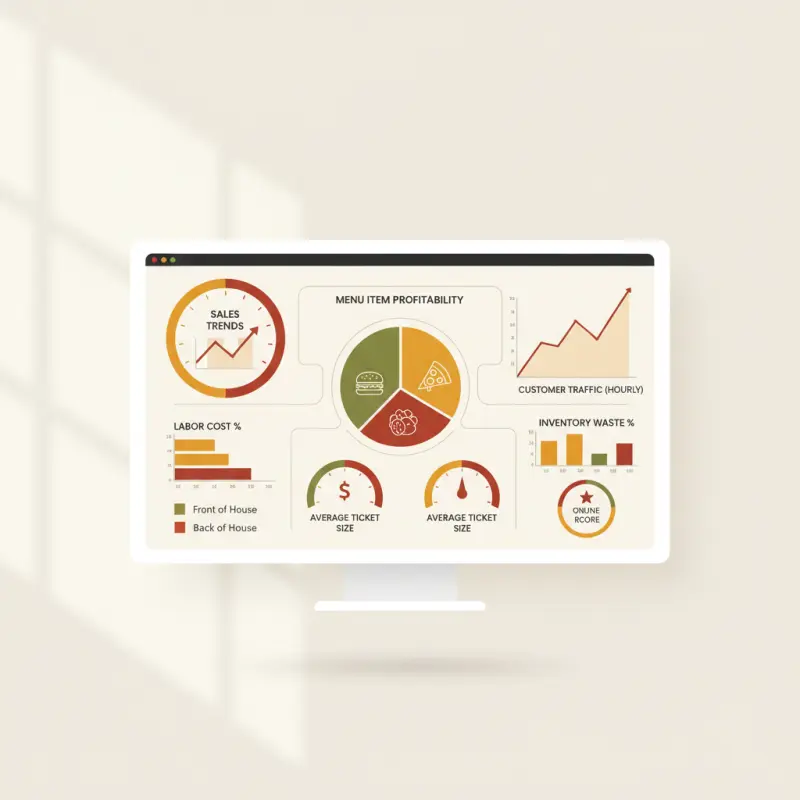
The 7 KPIs That Separate Profitable Restaurants from the Rest
After analyzing data from over 1,000 restaurants across Morocco, patterns emerge. The profitable ones track these seven metrics religiously. The struggling ones chase vanity numbers.
Revenue Per Available Seat (RevPAS)
Formula: Total revenue ÷ (seats × operating hours). This single metric tells you more about efficiency than any AI prediction.
In Agadir's tourist district, successful casual dining restaurants hit MAD 45-65 per seat per hour. Beach-view locations push MAD 80-90. Your 100-seat restaurant open 10 hours should generate MAD 45,000-65,000 daily. Below that? You're leaving money on the table — literally.
Food Cost Percentage Trending
Forget the industry standard 28-32% target. What matters is direction. A restaurant at 35% food cost growing revenue is healthier than one at 30% with costs trending upward.
Track daily, not monthly. A 2% month-over-month increase signals portion drift or supplier price hikes. Catch it in week one, save MAD 15,000. Miss it for a quarter, lose MAD 45,000.
Average Order Value by Day Part
Different times, different spending patterns. Here's what Moroccan restaurants typically see:
| Day Part |
Dine-In AOV |
Delivery AOV |
QR Table Order AOV |
| Breakfast |
MAD 35-50 |
MAD 45-60 |
MAD 40-55 |
| Lunch |
MAD 65-85 |
MAD 75-95 |
MAD 70-90 |
| Dinner |
MAD 95-120 |
MAD 110-140 |
MAD 100-125 |
Notice how QR table ordering consistently beats traditional server orders by 5-10%? Customers order more when browsing at their own pace. That's actionable data.
Table Turnover Rate
Fast casual restaurants need 3-4 turns per table daily. Fine dining? 1.5-2 turns. But here's what matters: consistency.
A Marrakech café averaging 3.5 turns suddenly dropping to 2.8? Check kitchen speed, server efficiency, or menu complexity. Each lost turn costs MAD 200-400 in revenue per table.
Your best-selling item might be your worst profit driver. Track contribution margin (price minus ingredient cost), not just popularity.
Example: A traditional tagine selling 65% of dinner orders at 40% margin contributes less profit than grilled fish at 20% of orders but 65% margin. Your restaurant sales forecasting software should flag these opportunities.
Peak Hour Revenue Concentration
Healthy restaurants generate 60-70% of daily revenue in a 6-hour window. Over 80%? You're vulnerable — one equipment failure or staff shortage crashes your day. Under 50%? Operational costs eat your margins.
OCHI's hourly revenue tracking shows this pattern clearly, helping you balance risk and efficiency.
Customer Return Rate by Acquisition Channel
Not all customers are equal. Track where they come from and how often they return:
- Direct/organic customers: 70-80% return within 30 days
- Social media: 45-55% return rate
- Third-party delivery apps: 15-25% return rate
One Rabat restaurant discovered their Instagram campaigns brought customers worth 3x more lifetime value than delivery app users. They shifted budget accordingly and increased profit 18%.
Why Daily Snapshots Beat Weekly Reports Every Time
The restaurant industry moves too fast for weekly reports. By the time you spot a problem in Monday's report about last week, you've already lost money you can't recover.
The 72-Hour Rule
Restaurant problems compound faster than interest. Food costs spiral daily. Labor inefficiencies multiply each shift. Inventory spoils while you wait for reports.
Consider fresh ingredients with 48-72 hour shelf lives. Weekly reporting means you discover waste after it's garbage. Daily tracking lets you adjust orders, change prep quantities, or run specials to move inventory.
One bad weekend can erase a month's profit. Friday's overstaffing plus Saturday's food waste plus Sunday's slow service? That's MAD 8,000-12,000 gone. Daily analytics catch issues after one bad day, not one bad week.
Real Numbers from Rabat Restaurants
Restaurant A implemented daily KPI tracking through their restaurant analytics software. Week two, they spotted a 12% food cost spike from portion creep. Quick retraining saved MAD 18,000 monthly.
Restaurant B stuck with weekly reports. Their labor overage went unnoticed for three weeks, costing MAD 25,000 in Q1 alone. The same problem, caught daily, would have cost MAD 3,000.
Every day of delay costs 0.5-1% of monthly profit. In a business with 5-8% margins, you can't afford to be late.
What Your Current System Isn't Telling You
Generic restaurant reporting software treats all orders equally. But a MAD 100 dine-in order and a MAD 100 delivery order have different profit margins, labor costs, and customer lifetime values.
Your delivery orders might show 20% lower margins than dine-in due to packaging costs and commission fees. But QR table orders? They often show 10% higher margins — no server labor, higher AOV, faster turnover.
Multi-location restaurants need branch-specific insights. Your Gueliz location might excel at lunch while Hivernage dominates dinner. Copy the right model to the right location.
Server efficiency directly impacts table turnover. A 15-minute difference in average service time? That's one less turn per shift, MAD 30,000 less monthly revenue for a 50-seat restaurant.
Kitchen speed affects everything: customer satisfaction drops 23% for every 10 minutes past expected delivery time. Return rates fall accordingly. Manager presence shows measurable impact — restaurants see 8-12% higher daily revenue when senior staff work peak hours.
Export Capability That Actually Works
Bank meetings need Excel. Investors want PDFs. Your accountant requires raw data. Yet most platforms make exports an afterthought.
OCHI delivers daily KPI snapshots in the format you need. Excel for number crunching, PDF for presentations, raw data API access for custom analysis. One Casablanca restaurant group used exported data to secure MAD 2 million in expansion funding — the bank loved seeing daily performance metrics, not monthly guesses.
Getting Started: Your First 30 Days
Implementing restaurant forecasting software doesn't mean overhauling operations overnight. Start small, measure consistently, then optimize based on data.
Week 1: Establish Baselines
Set up tracking for all seven core KPIs. Don't change anything yet — just observe. Document patterns: which days are strongest, which hours drag, which items sell together.
Export your first week's data. This becomes your baseline for measuring every future improvement.
Week 2-3: Identify Patterns
Compare weekday lunch against weekend dinner. Track how Ramadan affects hourly patterns. Notice when tourist seasons shift your customer mix.
Look for correlations: Does Wednesday's slow dinner predict Thursday's lunch volume? Do certain weather patterns affect specific menu categories? Your analytics software for restaurants should make these connections visible.
Week 4: First Optimization
Pick one insight and act on it. If data shows Tuesday lunch overstaffing, reduce by one server. If Caesar salad shows 70% margin but low sales, feature it as a special. If QR orders average 15% higher, add table tents promoting mobile ordering.
Measure the impact through your KPI framework. Did the change improve the target metric without hurting others?
The restaurants winning in 2024 don't need AI to predict next month's sales. They need clarity on today's operations, delivered fresh each morning, in time to make decisions that protect profit. That's what separates restaurant forecasting software that works from software that merely reports.
Ready to start tracking the metrics that matter? Set up your restaurant's data dashboard at votrenom.ochi.ma and see your first daily snapshot within 24 hours.