What Restaurant Analytics Software Actually Costs
The subscription fee is the smallest part of your investment. Here's what vendors avoid discussing:
| Cost Component |
Time Investment |
Financial Cost (MAD) |
| Initial Setup & Configuration |
20-40 hours |
5,000-15,000 |
| Staff Training |
15-25 hours |
3,000-8,000 |
| Data Migration & Cleanup |
10-30 hours |
2,000-10,000 |
| POS Integration |
5-20 hours |
0-25,000 |
| Monthly Maintenance |
5-10 hours |
Software fee only |
The Hidden 40-Hour Setup Most Vendors Don't Mention
Installing restaurant analytics software isn't like downloading an app. Historical data needs cleaning. Staff need training. Workflows require adjustment.
Budget 40 hours minimum for proper implementation. Rushing this phase guarantees garbage data and abandoned dashboards within three months.
Why "Free" Analytics Software Costs More Long-Term
Free tools limit data exports, cap historical storage, and lock you into their ecosystem. When you outgrow them — and you will — migration becomes a nightmare.
OCHI maintains full data portability. Export everything to Excel or PDF anytime. Your data remains yours, as we've discussed in our data ownership guide.
Integration Nightmares: When Your POS Won't Talk to Your Analytics
A Rabat restaurant group spent 50,000 MAD on analytics software that couldn't integrate with their existing POS. Six months later, they abandoned it entirely.
Check integration compatibility before anything else. Pretty dashboards mean nothing if data entry becomes manual.
Daily Snapshots vs. Real-Time Dashboards
Here's an unpopular truth: real-time dashboards create more problems than they solve for most restaurants.
Watching metrics fluctuate throughout service triggers reactive decisions. That dip in orders at 2:17 PM? Meaningless noise that causes unnecessary panic.
Why Real-Time Data Overwhelms Restaurant Managers
Restaurant managers juggle 50 decisions hourly. Adding a real-time analytics dashboard creates decision paralysis, not clarity.
Daily summaries work better. Review yesterday's performance each morning with fresh eyes. Spot patterns, not momentary blips.
The Case for Simple Daily Reports
OCHI delivers automated daily snapshots at 6 AM — revenue, top items, cost analysis, and those seven critical KPIs. One PDF, five minutes to review, actionable insights for the day ahead.
This approach respects how restaurants actually operate. You don't need restaurant sales forecasting software predicting next month when today's service demands full attention.
When You Actually Need Live Analytics
Live dashboards serve specific scenarios: monitoring multiple locations, tracking limited inventory items, or managing delivery radius performance.
But for single-location restaurants? Daily reports deliver better signal-to-noise ratios.
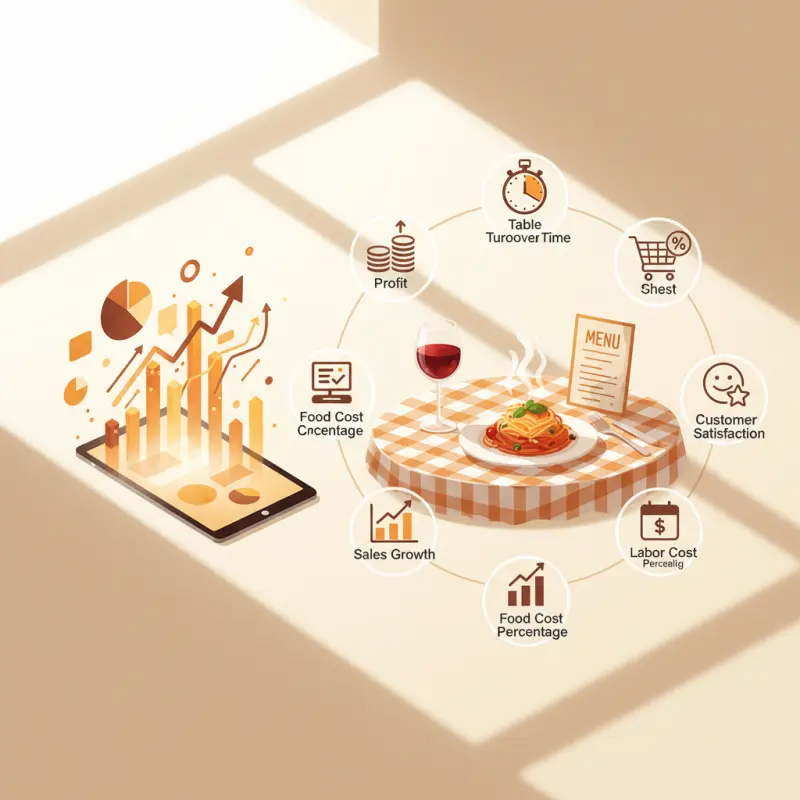
Reading Your Restaurant Data Like a Profit Statement
Raw numbers tell stories if you know the language. Pattern recognition beats statistical analysis in restaurant operations.
Three Warning Signs Hidden in Your Analytics
Declining weekend AOV despite steady traffic suggests menu fatigue — regular customers ordering less adventurously. Address this before revenue follows.
Rising food costs with stable menu prices indicates portion creep or supplier price hikes. Both kill margins silently.
Shortened peak hours mean service bottlenecks. You're leaving money on tables that could turn once more.
Look for high-margin items with low order frequency. These hidden gems need better placement or description, not removal.
OCHI's item performance analytics highlight these opportunities automatically, suggesting which dishes deserve promotion.
Setting Realistic Forecasting Goals for Moroccan Restaurants
Seasonal patterns in Morocco differ from global templates. Ramadan, summer tourism, and local festivals create unique rhythms.
Set forecasts based on your historical patterns, not industry averages. A beachfront Agadir restaurant faces different seasonality than a Fès medina cafe.
From Spreadsheets to Insights
Many restaurant owners fear losing control when moving from manual spreadsheets to analytics software for restaurants. This fear is valid but manageable.
Exporting Your Data: Why You Need an Exit Strategy
Never trust restaurant reporting software that locks your data inside. Monthly exports to Excel should be standard, not premium.
OCHI provides one-click exports of everything: full transaction logs, ingredient costs, customer data, analytics history. Build your own reports alongside ours.
Training Your Team to Trust the Numbers
Start with one metric. Track food cost percentage for a month. Show your chef how recipe adjustments impact the bottom line.
Build analytics confidence gradually. Force-feeding dashboards to skeptical staff guarantees resistance.
Building Analytics Habits That Stick
Morning review rituals work better than constant monitoring. Check yesterday's snapshot with your coffee. Note surprises. Plan adjustments. Move on.
The goal isn't becoming a data scientist. It's making better decisions with clearer information.
Restaurant business intelligence & analytics software only works when it fits your workflow, not the other way around. Choose tools that respect your expertise while adding clarity where spreadsheets create confusion. See how OCHI brings analytics to life at votrenom.ochi.ma.